Results
The Results block (found under Quantum in the Tools panel) shows a circuit's measurement outcomes, the Qanvas equivalent of Qompile's Probabilities and Statevector panels combined into one block. It uses the same circuit-selector dropdown described on the Coding page, pick a circuit by name to show its results here.
Tabs
Three tabs across the top switch between views of the same run:
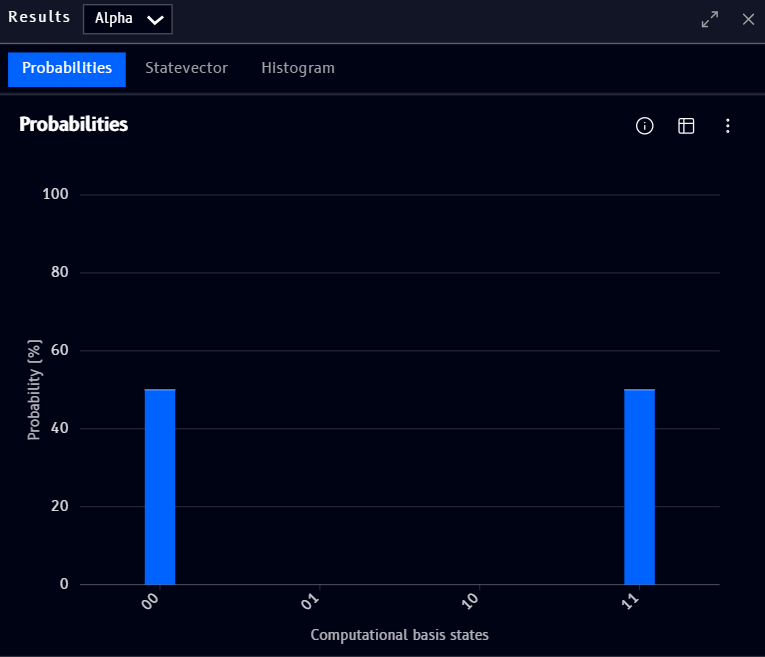
- Probabilities - a bar chart of measurement outcome probabilities, one bar per computational basis state, shown above
- Statevector - the exact complex amplitudes behind those probabilities, see Qompile's Statevector page for how to read it
- Histogram - shot-by-shot outcome counts from running the circuit
Note
The exact values shown above are just an illustration of the UI, not a worked example, don't read them as a specific claim about what any particular circuit produces.
For the info tooltip, table view, and options menu (download, hide zeros, etc.), these work the same way as Qompile's Probabilities panel.