Probabilities
The Probabilities panel shows a bar chart of the measurement outcome probabilities for your circuit - one bar per computational basis state:
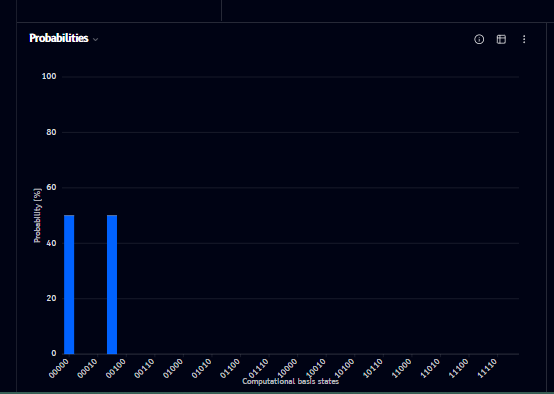
- The x-axis lists computational basis states (e.g.
00000,00010,00100, ...) - The y-axis shows probability as a percentage
- Bars update live as you build your circuit
Info
Click the ⓘ icon (top-right of the panel) to see an explanation of what the chart shows:
Measurement probabilities |⟨x|ψ⟩|² for each computational basis state after running the circuit. Toggle the table icon to see exact values, or hide near-zero outcomes from the options menu.
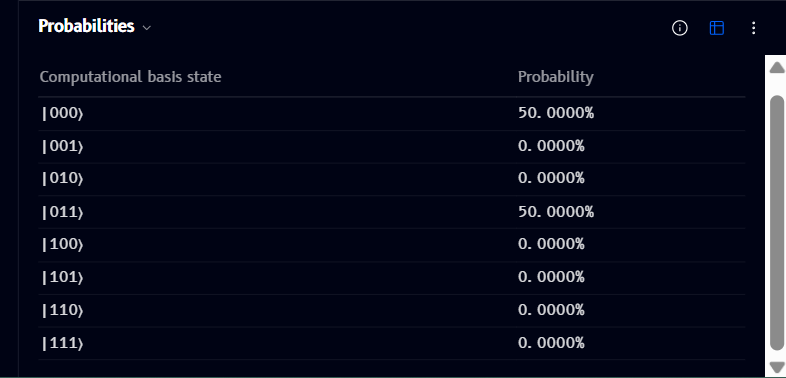
Table view
Click the table icon (top-right of the panel, next to info) to switch from the bar chart to an exact-value table, listing every basis state with its precise probability:
Options menu
Click the ⋮ (more options) icon to open a menu with:
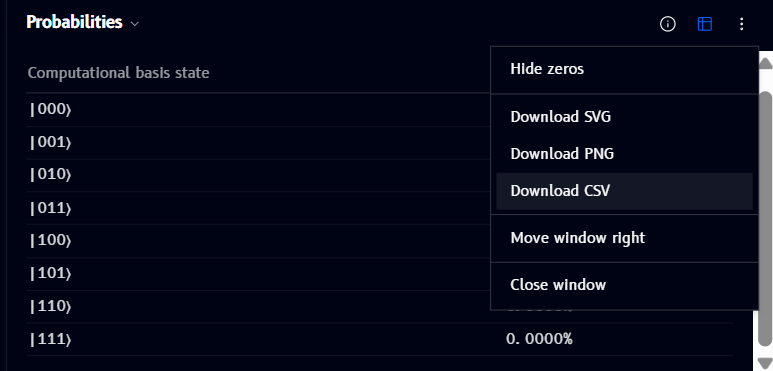
- Hide zeros - hide basis states with (near-)zero probability from the chart/table
- Download SVG / Download PNG / Download CSV - export the current chart or table
- Move window right / Close window - see Managing windows