Statevector
The Statevector panel shows your circuit's quantum state as both a bar chart of amplitudes and the raw statevector array:
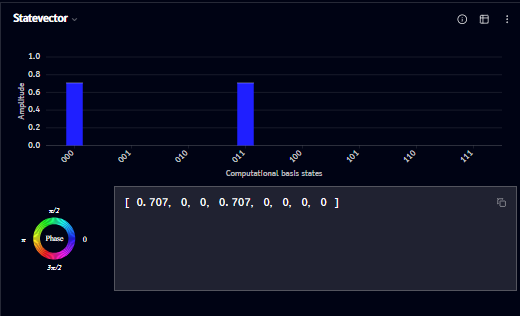
- The bar chart plots amplitude magnitude against each computational basis state; bar color reflects phase
- Below the chart, the full statevector is printed as an array of amplitude values (e.g.
[0.707, 0, 0, 0.707, 0, ...]), with a copy icon to copy it directly - The small Phase color wheel (bottom left) shows the same phase-to-color mapping used in the Q-Sphere
Info
Click the ⓘ icon (top-right of the panel) to see an explanation of what the chart shows:
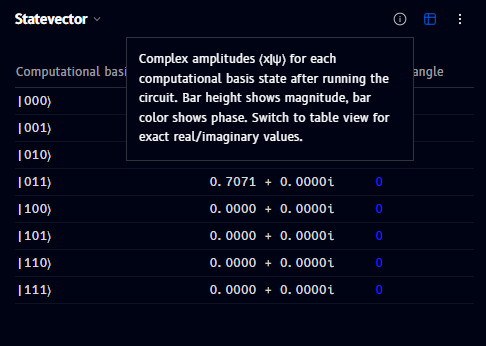
Complex amplitudes ⟨x|ψ⟩ for each computational basis state after running the circuit. Bar height shows magnitude, bar color shows phase. Switch to table view for exact real/imaginary values.
Phase info
Bar color in the chart encodes phase, using the same Phase color wheel legend shown in the panel and in the Q-Sphere.
Vector info
The array below the chart is the exact statevector - each entry is one basis state's complex amplitude, in the same left-to-right order as the chart's basis states.
Table view
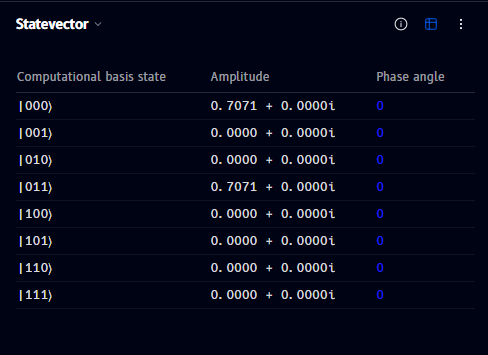
Click the table icon (top-right of the panel, next to info) to switch to an exact-value table, showing each basis state's amplitude as a full complex number (real + imaginary) alongside its phase angle:
Options menu
Click the ⋮ (more options) icon to open a menu with:
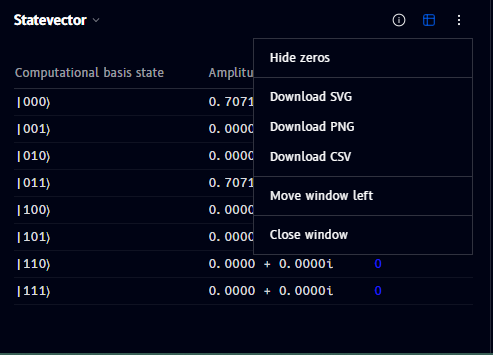
- Hide zeros - hide basis states with (near-)zero amplitude
- Download SVG / Download PNG / Download CSV - export the current chart or table
- Move window left / Close window - see Managing windows