Q-Sphere
The Q-Sphere panel renders your circuit's quantum state as points on a 3D sphere - one point per basis state with non-zero amplitude, positioned and colored to reflect its phase:
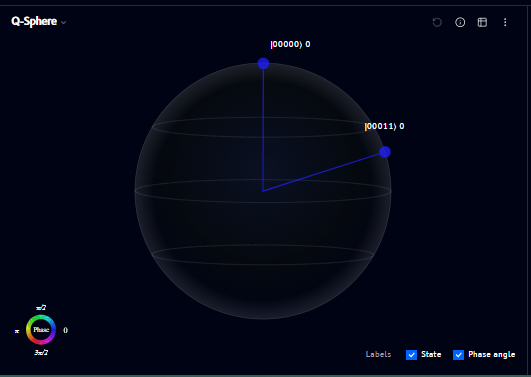
- Each labeled point (e.g.
|00000⟩,|00011⟩) is a basis state present in the superposition - The line from the center to each point represents that state's contribution
- The Phase color wheel (bottom left) maps color to phase angle (0, π/2, π, 3π/2)
Info
Click the ⓘ icon (top-right of the panel) to see an explanation of what the sphere shows:
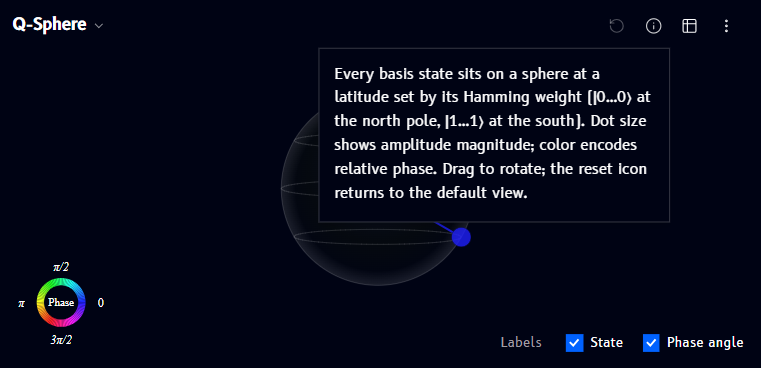
Every basis state sits on a sphere at a latitude set by its Hamming weight (|0...0⟩ at the north pole, |1...1⟩ at the south). Dot size shows amplitude magnitude; color encodes relative phase. Drag to rotate; the reset icon returns to the default view.
Phase info
The Phase color wheel legend (bottom-left of the panel) shows the color-to-angle mapping used for the points on the sphere - this is what the "color encodes relative phase" part of the info tooltip refers to.
State and phase angle labels
Two checkboxes under Labels (bottom right) toggle what's shown next to each point:
- State - the basis state label (e.g.
|00011⟩) - Phase angle - the numeric phase angle for that state
Return to initial position
The reset/rotate icon (top-right of the panel, leftmost in the icon group) returns the sphere to its default orientation after you've dragged to rotate it.
Table view
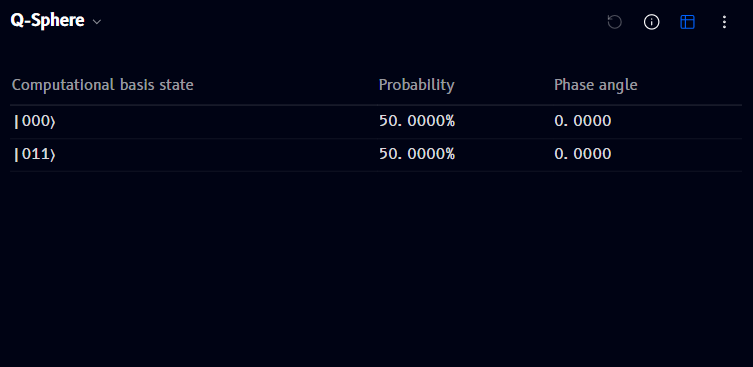
Click the table icon (top-right of the panel) to switch from the 3D sphere to an exact-value table, listing each basis state's probability and phase angle:
Options menu
Click the ⋮ (more options) icon to open a menu with:
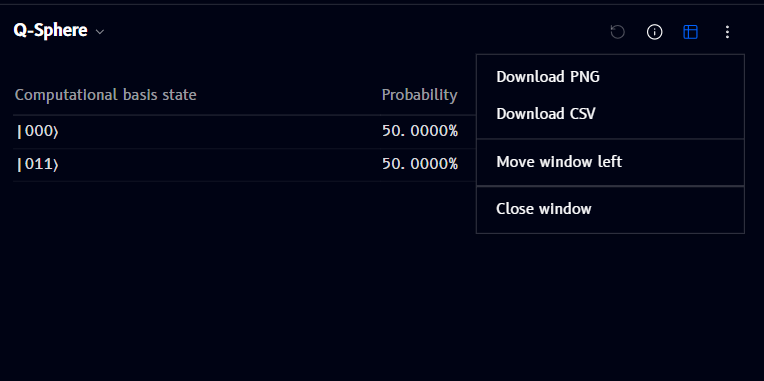
- Download PNG / Download CSV - export the current view or table
- Move window left / Close window - see Managing windows